Data Engineering Projects (ETL, Data Integration, Analysis, Cleaning, BI):
Iowa Liquor Sales Data Analysis: [ER/Studio, Talend, Alteryx, SQL Server, Google BigQuery, Tableau, Power BI]
• Crafted an intricate and efficient dimensional model, seamlessly handling a vast volume of 24 million records from Iowa Liquor Sales data
• Orchestrated the data load process with finesse, leveraging the prowess of Talend, Alteryx, and SQL Server. Employed advanced techniques such as tMap, tReplace, tAggregateRow, and triggers on Talend to ensure data integrity and precision
• Transformed complex data into captivating visualizations, showcasing over 50 meticulously crafted reports and dynamic dashboards using Tableau and Power BI to showcase essential KPIs
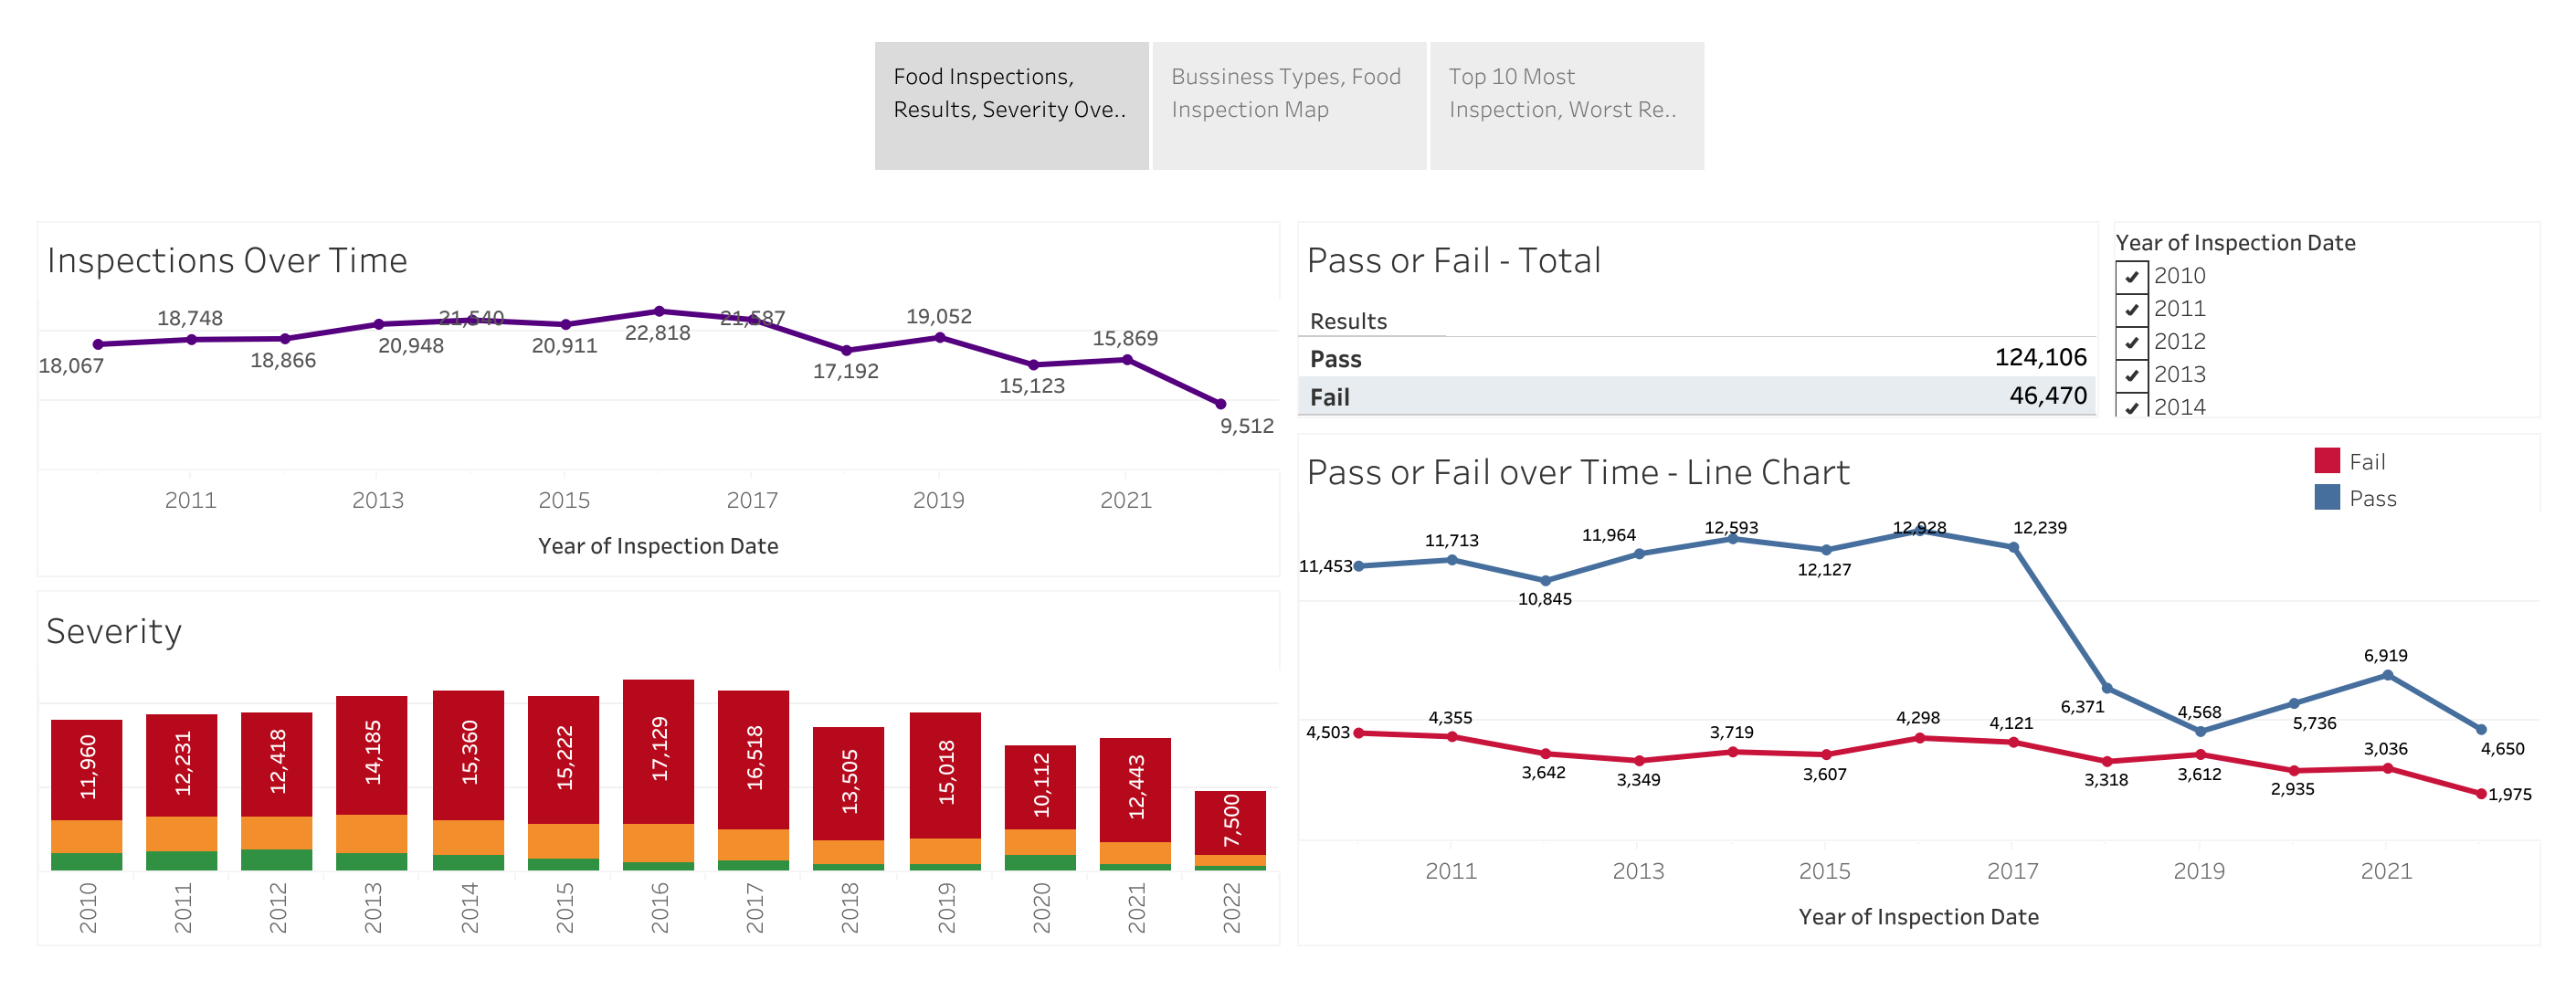
Analysis of New York, Dallas, and Chicago Food Inspection : [ER/Studio, Alteryx, SQL Server, Tableau, Power BI]
• Developed comprehensive dimensional models to establish 6 fact tables and 20 dimensional tables specifically tailored to New York, Dallas, and Chicago
• Utilized Alteryx to execute data profiling, transformations employing regular expressions and parsing techniques, and data-cleaning operations
• Created an extensive collection of 100+ reports and dashboards using Tableau and Power BI to highlight inspections, violations, and severity over time
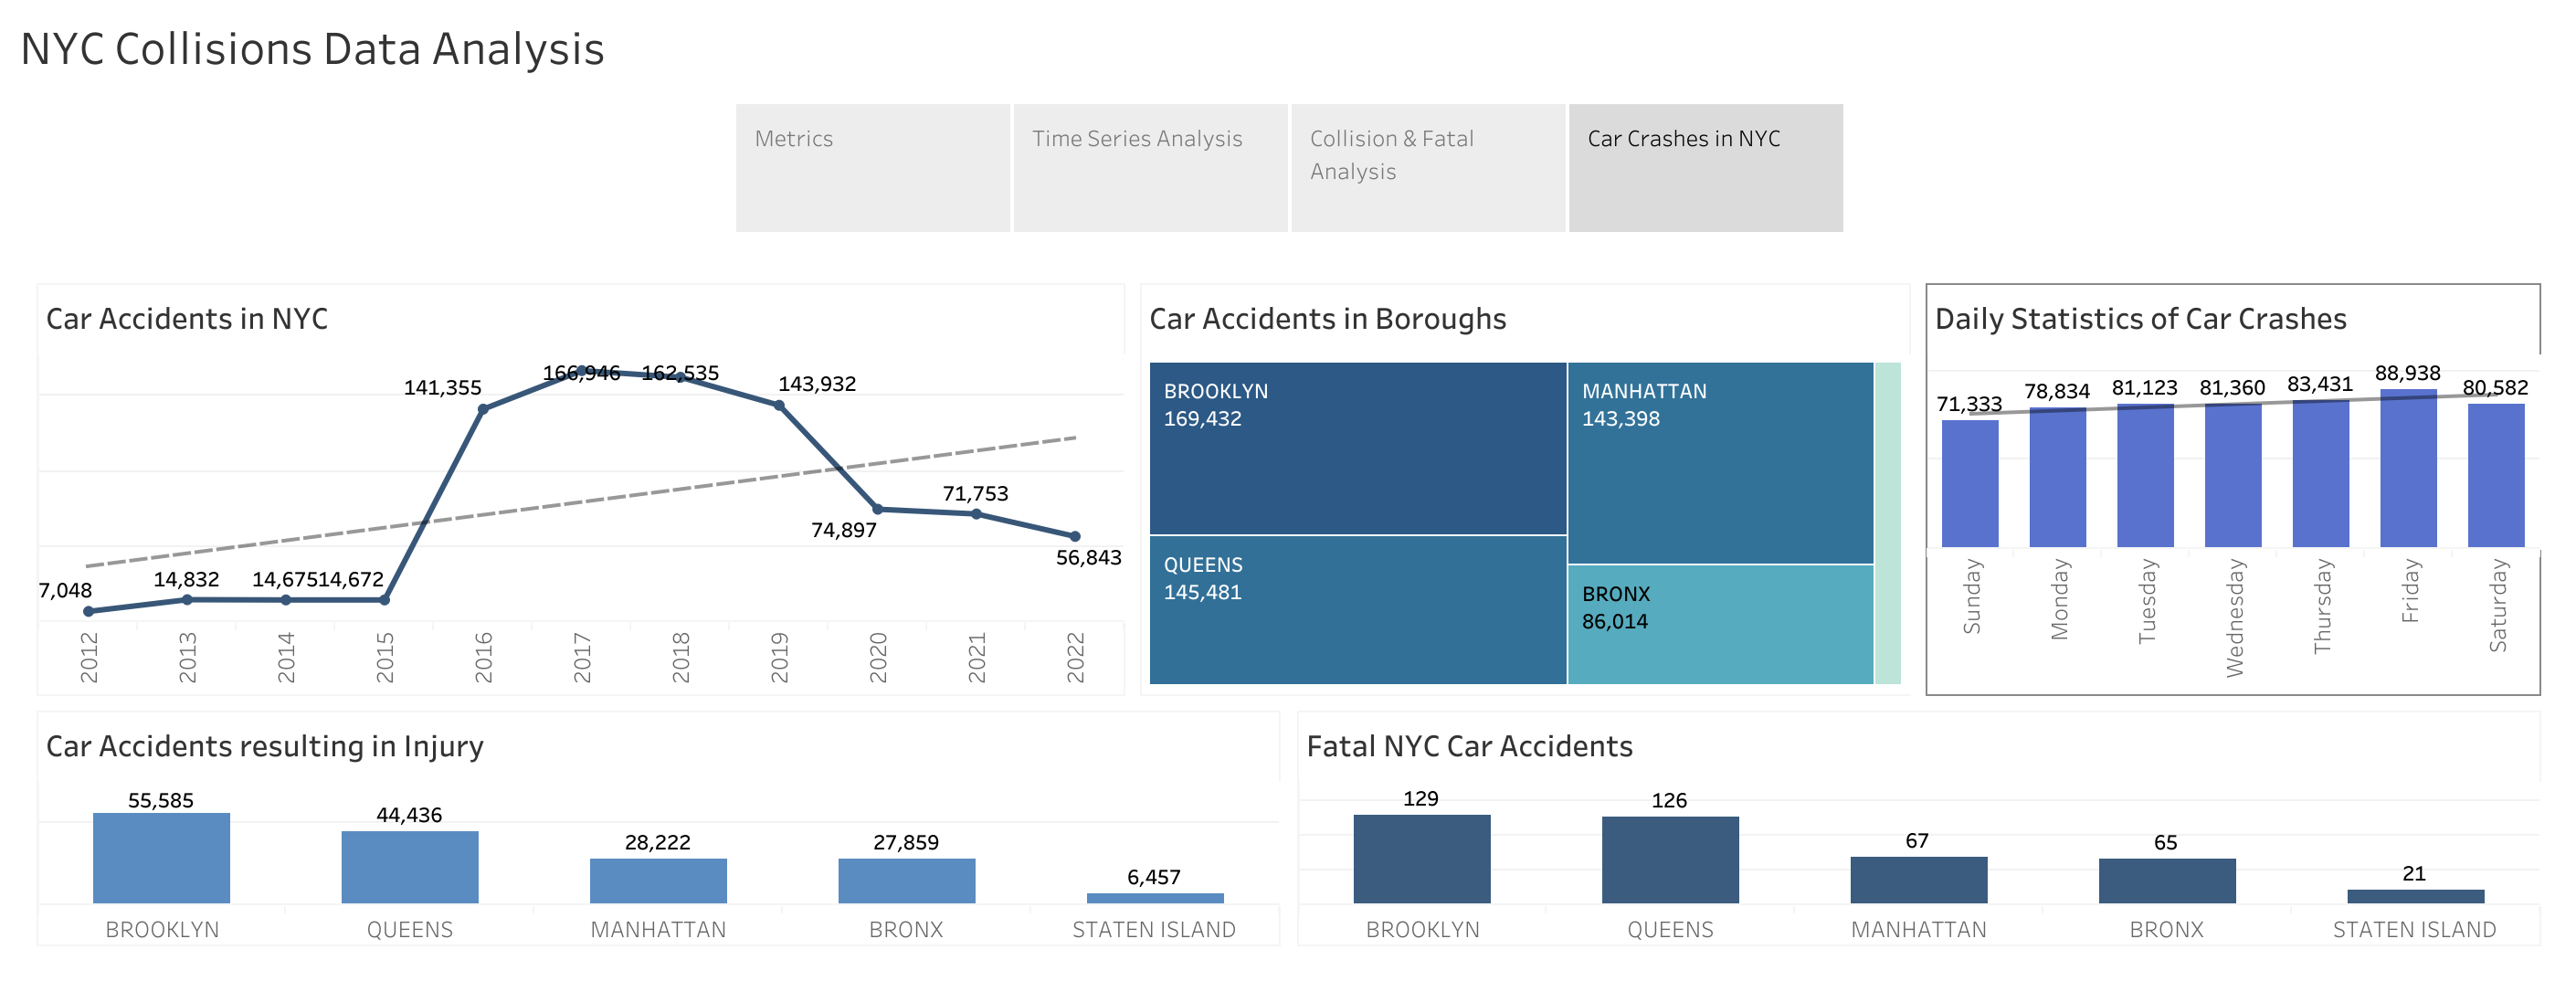
NYC Motor Vehicle Collisions Analysis : [ER/Studio, Alteryx, Talend, SQL Server, Google BigQuery, Tableau, Power BI]
• Developed comprehensive dimensional models to create 7 fact tables and 26 dimensional tables, tailored specifically to store and analyze 1.99 million rows of NYC Motor Vehicle Collision data
• Utilized Alteryx to execute data profiling on three source files obtained from Google BigQuery and TSV files and stored them in staging tables for further processing
• Implemented error tables in Talend to effectively identify anomalies and cleanse the data, ensuring high data quality and accuracy
• Performed data loading from multiple sources and conducted data cleaning operations using various components in Talend, such as tMap, tReplace, tUniqRow, tSplitRow, and tUnpivotRow
• Created an extensive collection of over 70 reports and dashboards using Tableau and Power BI to visualize the analysis of metrics, time series, collision patterns, and fatal incidents, providing valuable insights into the dataset
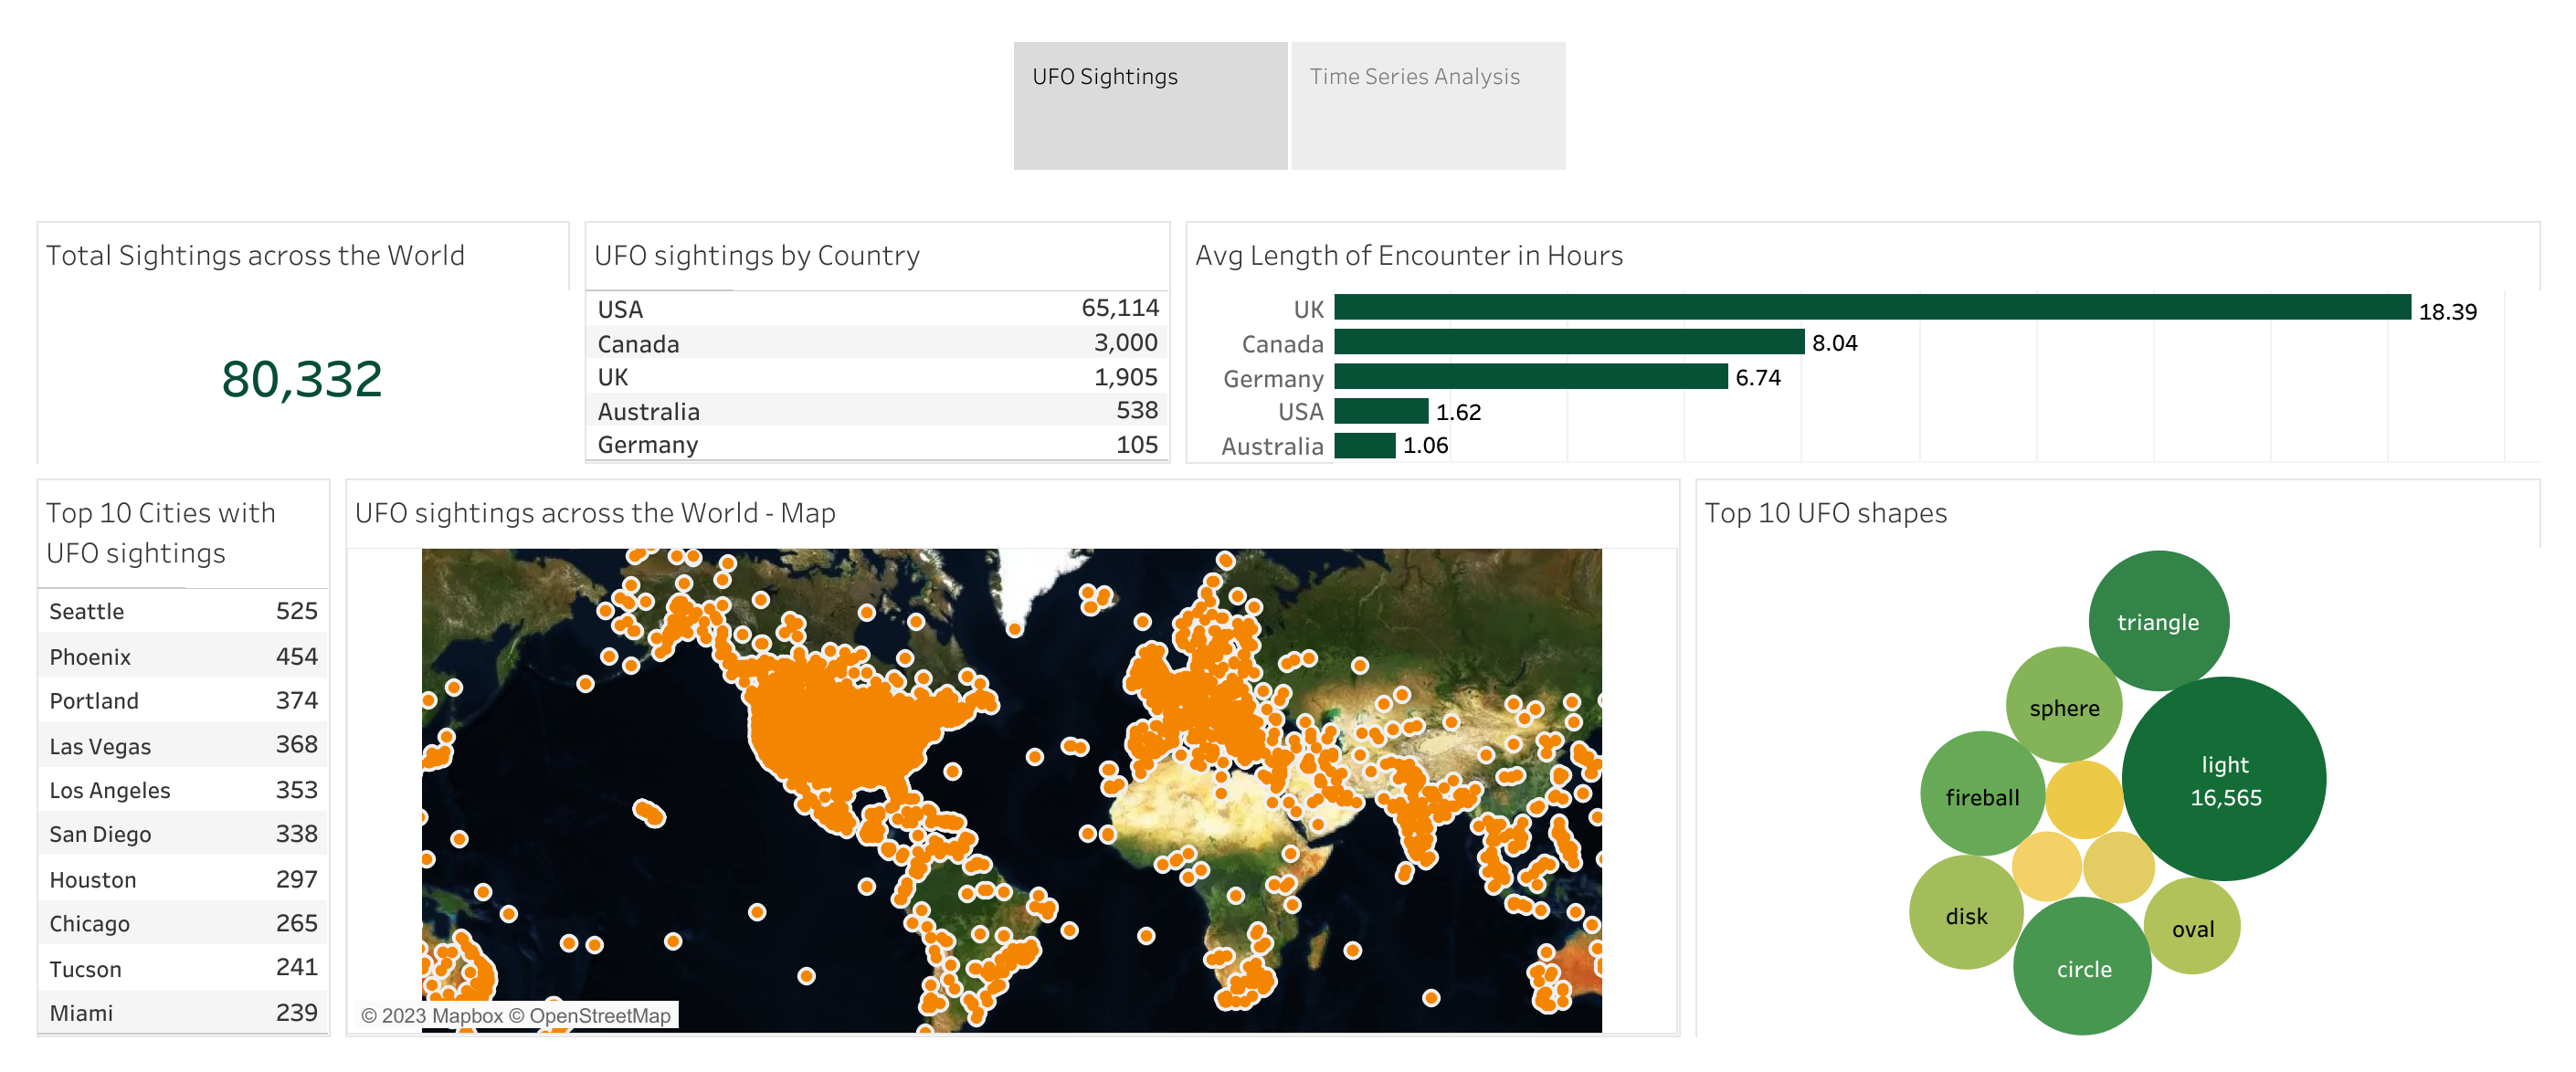
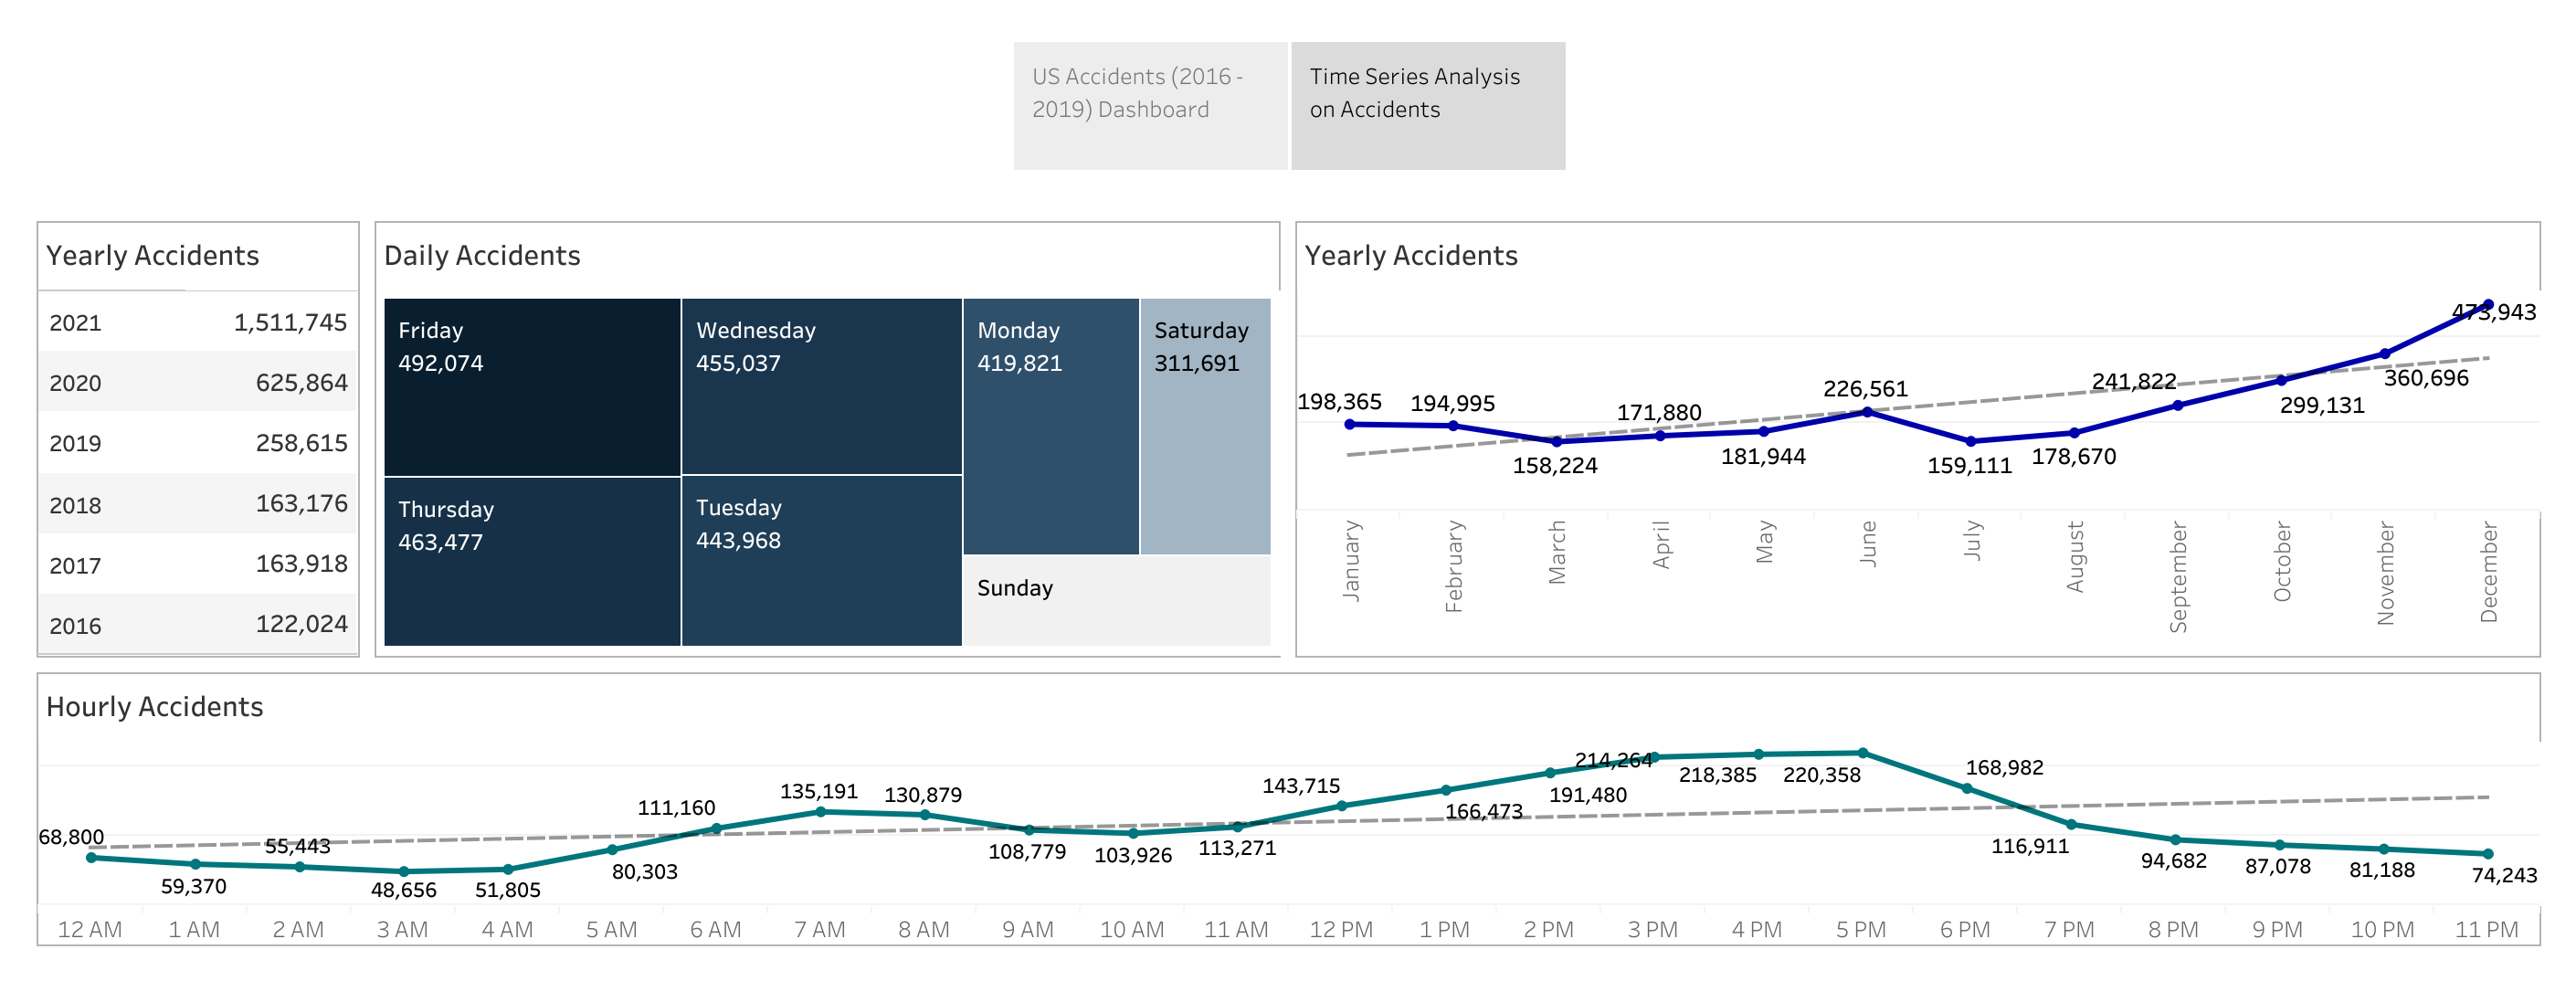
Data Analysis of US Accidents (2016 - 2021) : [Python, Tableau]
• Utilized Python to perform data profiling, cleansing, and wrangling tasks on a substantial dataset titled "US Accidents (2016-2021)," encompassing more than 2.5 million rows
• Leveraged Tableau to employ advanced visualization techniques, generating comprehensive reports and interactive dashboards that effectively revealed data patterns, trends, and outliers
SDN Intrusion Detection Data Analysis : [Neo4j, Python (Pandas, Matplotlib, Seaborn)]
• Identified more than 344,000 instances of malicious attacks in the SDN Intrusion Detection data
• Devised a robust data model comprising nodes and relationships to accurately represent and analyze 1 million rows of data, enabling comprehensive reporting and BI analysis to showcase various attack types and their distinctive characteristics
Data Visualizations:
"The goal is to turn data into information, and information into insight." - Carly Fiorina
Web Development:
This Website : [Visual Studio Code, Git, React, CSS, Vercel]
• Designed the website to effectively highlight personal traits, skills, and achievements for potential employers or clients
• Implemented Git for version control and Vercel for seamless Continuous Deployment